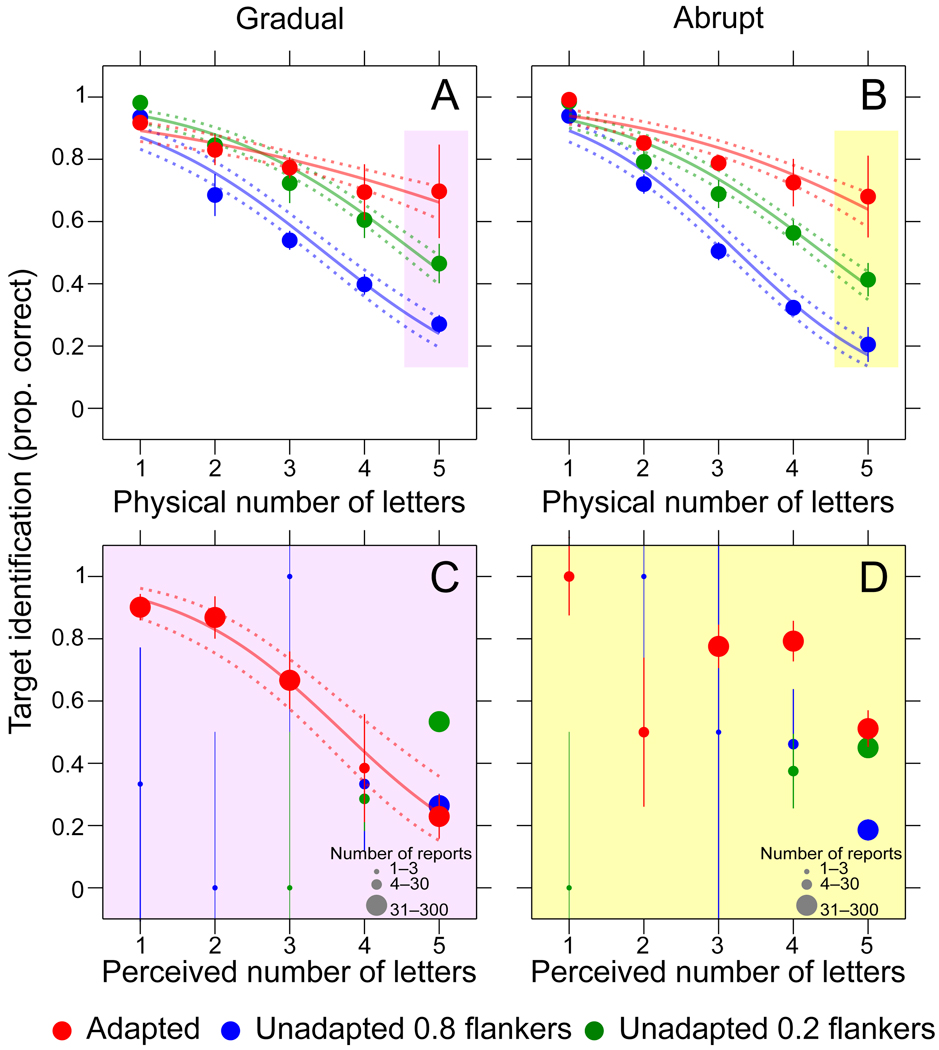
Figure 3. Identification performance.
Number of letters versus target identification performance (proportion correct), for four observers. (A) Physical number of letters presented, from one (target alone) to five (target with four flankers) versus target identification performance for gradual condition for adapted (red) and unadapted with 0.8 contrast flankers (blue), and unadapted with 0.2 contrast flankers (green), averaged across the four observers. Solid lines show best-fitting logistic curves to these data (dashed lines indicate 95% confidence limits on curve fits). Error bars on data points indicate +/− 1 SEM across observers. (B) Same as (A) but for abrupt condition. (C) The average of all trials (pooled across observers) when 5 letters were presented gradually (pink shaded points in A) replotted according to the number of letters reported on each trial. Error bars depict +/−1 binomial standard deviation. Symbol sizes are scaled according to the number of responses making up that data point, where larger symbols indicate more reports (see inset legend). The faint red line is a logistic curve fit to the adapted data. Performance is well predicted by the number of letters perceived. (D) Same as (C) for abrupt condition. Statistical analyses of these data are presented in Figure S2.

