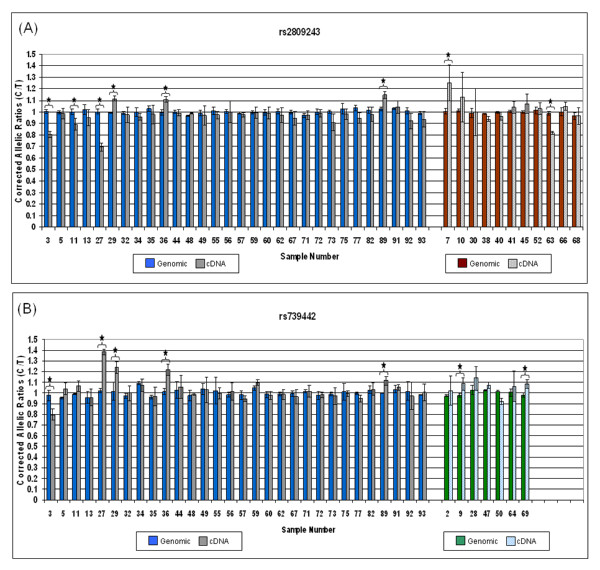
Figure 3.
AEI analysis of TSC1 mRNA expression in leukocytes isolated from 30 individuals doubly heterozygous for the marker SNPs rs2809243 and rs739442 and additional individuals (11 and 7 individuals respectively) singly heterozygous for one of the two SNPs. For doubly heterozygous individuals (data at the left side of graphs 3A and 3B), blue bars indicate corrected genomic allelic ratios (AR) and grey bars indicate the corrected cDNA ARs. Data for singly heterozygous individuals is located to the right side of the 3A and 3B graphs using red and green bars to indicate genomic ARs and shaded bars to indicate cDNA ARs. Error bars indicate 2X the standard error of the mean (SEM). Stars indicate samples for which the average corrected cDNA AR differed from the genomic AR by more than 10% and had error bars that did not overlap with those of the genomic DNA.

