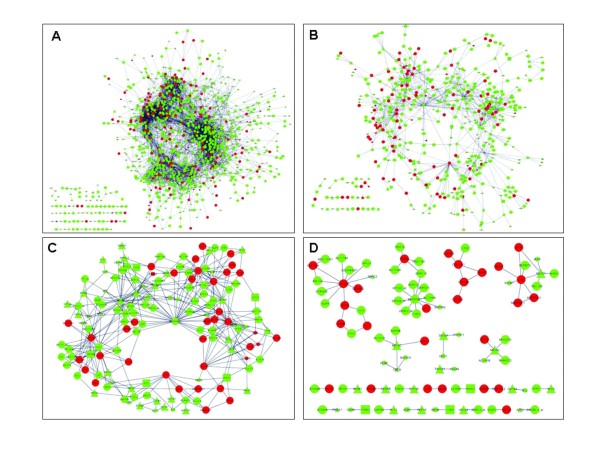
Figure 5.
The Always Conserved network visualized using the Cytoscape software at our levels of resolution: (A) Connections involving at least one top candidate gene; (B) derived from A where only genes with more than two connections are displayed; (C) derived from B where only connections that were deemed to be significant across the four original networks (Adenoma, Carcinoma, Inflammation and Normal) are displayed; and (D) only those connections involving at least one top candidate gene in the four networks. The specific nature of edges, nodes and other features such as shape and color along with the Cytoscape file is provided in our website http://www.livestockgenomics.csiro.au/courses/crc.html

