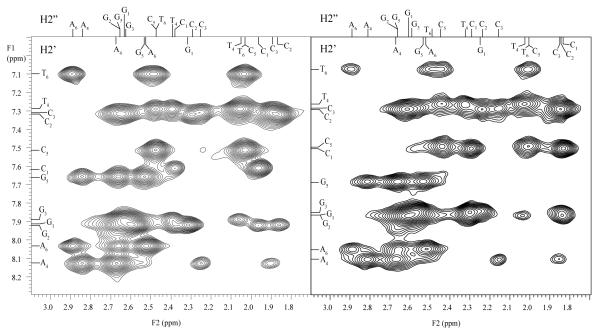
Figure 2.
Selected region of the NOESY spectra of the DNA dodecamer in 50 mM Tris buffer in D2O at pH 8.5 and at 15°C. The left spectrum is in the absence of Mg2+ and the right spectrum is in the presence of 200 mM Mg2+ ions. The cross-peaks are NOESY connectivities between H8/H6 protons on nucleobases (F1 dimension) and deoxyribose H2′/H2″ protons (F2 dimension).

