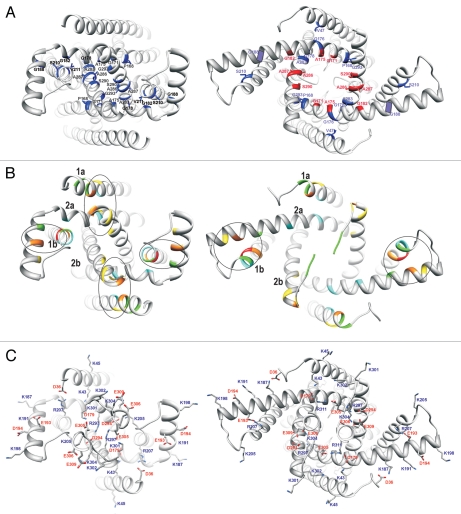
Figure 3.
Ribbon representations of the inner pore region of closed (left) and open (right) models viewed from the inside. (A) Small residues located at positions of close contact between helices are colored blue. Small residues that become exposed in the lining of the pore when the channel opens are colored red. (B) High degree, high MI positions obtained from the MSA of TREK homologs, used as a modeling criteria. Residues with the highest degree values are colored according to the color spectrum scheme used in Supplementary Table 1, red for the highest score and cyan for the lowest. (C) Charged residues of the inner pore segments. Side chains are colored by element (gray = carbon, blue = nitrogen, red = oxygen, white = hydrogen). Positively charged resides are labeled in blue, negatively charged residues in red.

