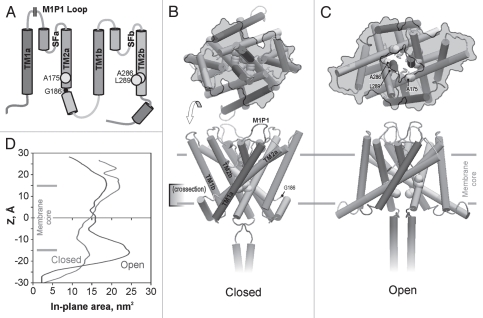
Figure 1.
The topology of TREK-1 protein (A) and the structural models of the closed (B) and open (C) state built by homology to crystal structures of KcsA. The domains in the structures are color-coded as in the topology scheme (A); M1P1 designates the location of the extracellular 50-residue loop not included in the models. The yellow balls show the predicted positions of the hydrophobic residues forming the gate. G186 is the hinge glycine between the TM2a and the putative connector helix linking it to TM1b. In-plane expansion of the channel on opening (upper images on (B and C), as viewed from the cytoplasm) is illustrated by the gray contours marking the solvent-accessible channel surface for a slab between the levels of the gate (−5 Å) and the maximum tension on the cytoplasmic side (∼−15 Å). Detailed in-plane area profiles along the z coordinate (D) estimate the total area change of the cytoplasmic part associated with the opening transition as ∼5 nm2. Color versions of our figures can be seen at http://www.landesbioscience.com/journals/channels/article/13906/

