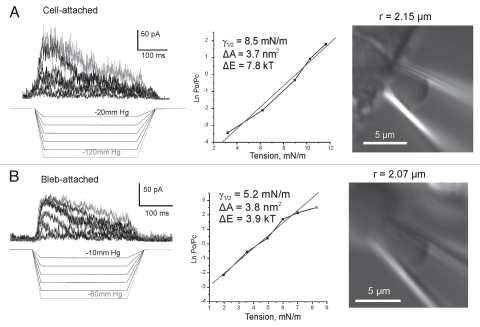
Figure 2.
Dose-response curves obtained with patch imaging. TREK-1 activates in cytoskeleton-depleted blebs at considerably lower tensions than in regular cell-attached patches (HEK-293T cells). Imaging of patches was done in DIC with large-diameter (BN7) bent pipettes. Currents were recorded +40 mV in the pipette. The pressure protocols are depicted below the current traces. Fitting of the activation curves was done with the equation: kT·ln(Po/Pc) = −ΔE + γΔA, where Po and Pc are the probabilities of the channel finding in the open or closed states, ΔE is the free energy difference between the states, γ is tension, and ΔA is the area change associated with the transition. Color versions of our figures can be seen at http://www.landesbioscience.com/journals/channels/article/13906/

