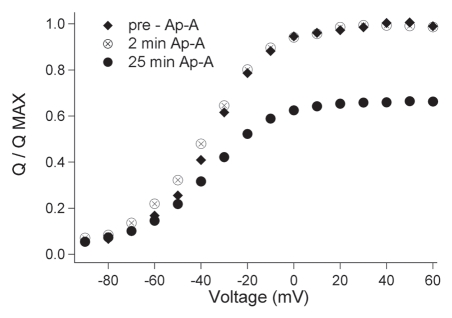
Figure 11.
Time course of anthopleurin effect on charge movement in rNaV1.4. Step commands from a holding potential of −120 mV to voltages ranging from −90 mV to 60 mV were delivered at 30 s intervals for 25 min. The effect of anthopleurin on Q/QMAX prior to exposure, at 2 min, and at 25 min after application are shown. Values represent mean of five experiments with error bars removed for clarity.

