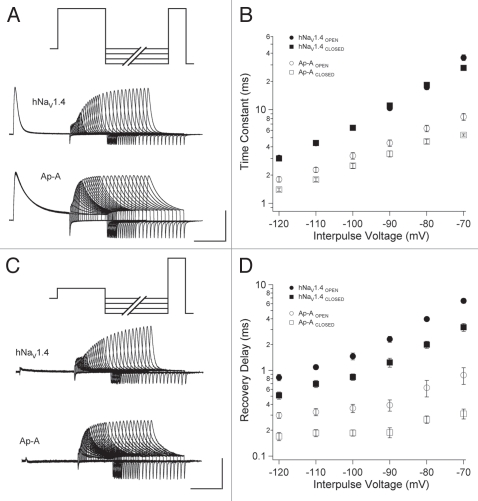
Figure 6.
Double pulse protocols used to measure recovery from open-state (A) or closed-state (B) fast inactivation. Recovery traces are shown following −90 mV interpulse commands. Recovery time constants (C) and delays in onset (D) are plotted for naïve or anthopleurin-modified channels. Values represent mean ± SEM for 16 to 20 experiments. Calibration: vertical 500 nA; horizontal 5 ms.

