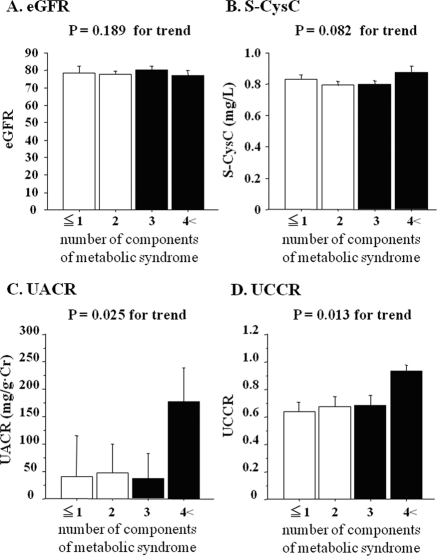
Figure 2.
The values of eGFR (A), S-CysC (B), UACR (C), and UCCR (D) stratified according to the number of components of metabolic syndrome after gender and age adjustment. The data are shown as the means ± SEM. The differences between groups were assessed by ANCOVA. Nonmetabolic syndrome and metabolic syndrome are indicated by the open and closed bars, respectively.

