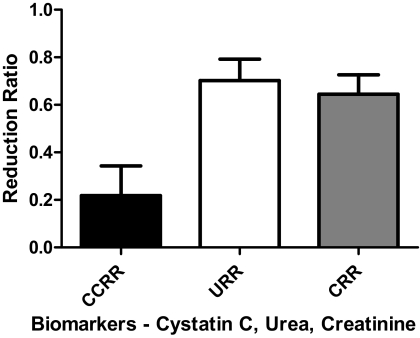
Figure 2.
Cystatin C, urea, and creatinine reduction ratios. The reduction ratio for each of the biomarkers is shown. The values for URR, CRR, and CCRR were 70.2% ± 9.0%, 64.5% ± 8.2%, and 26.1% ± 11.8%, respectively. By paired t test, each postdialysis biomarker concentration was significantly lower than the predialysis value (P = 0.002).

