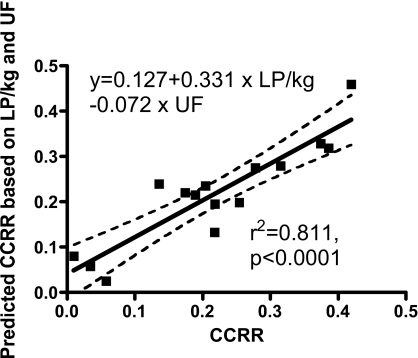
Figure 3.
Correlation analysis of the measured CCRR and the calculated CCRR based on a model using the ultrafiltration volume (UF [L]) and the normalized liters processed (LP/kg [L/kg]). The model explained 81% of the variance. This figure shows a highly significant linear correlation between the predicted CCRR and the measured CCRR (r2 = 0.811, P < 0.001).

