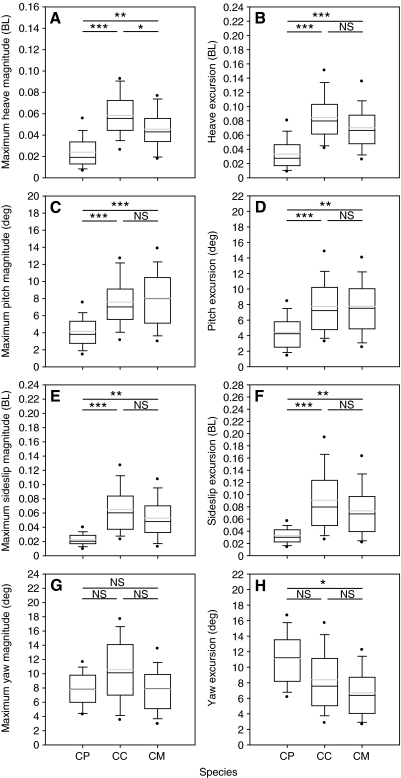
Fig. 5.
Box-plots comparing values of body stability for eight focal parameters with results of pair-wise nested ANOVAs. Painted turtles (CP; N=96), loggerhead turtles (CC; N=120) and green turtles (CM; N=72). Boxes enclose the median (centerline) and the 25th and 75th percentiles (bottom and top of boxes, respectively). Whiskers indicate the 10th and 90th percentiles; circles indicate the 5th and 95th percentiles. Light gray lines indicate the mean. Significance levels: *P<0.05, **P<0.01, ***P<0.001; NS, not significant. Endpoints of horizontal lines indicate species used in each test. Sequential Bonferroni correction did not alter significance of pair-wise comparisons.

