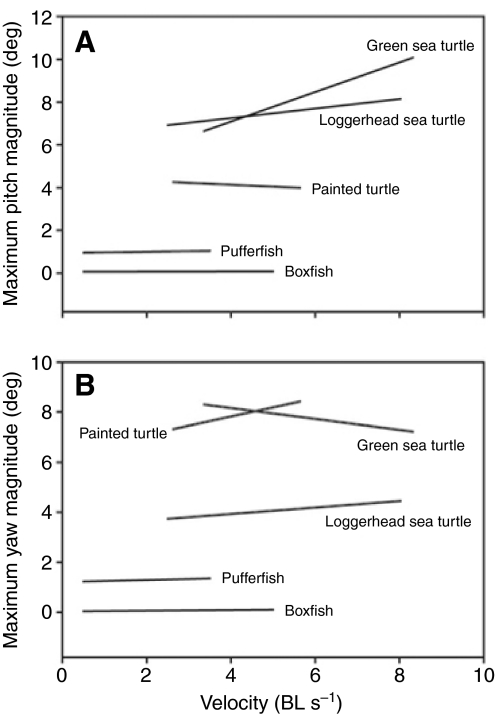
Fig. 6.
Relationship between swimming velocity and (A) pitch, and (B) yaw for five species of rigid-bodied vertebrates. Lines are regression lines; ranges of lines along the x-axis depict the swimming speeds at which data were collected for the respective studies. Pitch: painted turtle, y=-0.089x+4.49 (this study); loggerhead turtle, y=0.223x+6.358 (Dougherty et al., 2010); green turtle, y=0.694x+4.31 (Dougherty et al., 2010); boxfish, y=0.004x+0.062 (Hove et al., 2001); pufferfish, y=0.03x+0.94 (Wiktorowicz et al., 2007). Yaw: painted turtle, y=0.365x+6.36; loggerhead turtle, y=0.130x+3.41 (Dougherty et al., 2010); green turtle, y=-0.218x+9.03 (Dougherty et al., 2010); boxfish, y=0.013x+0.034 (Hove et al., 2001); pufferfish, y=0.04x+1.21 (Wiktorowicz et al., 2007).

