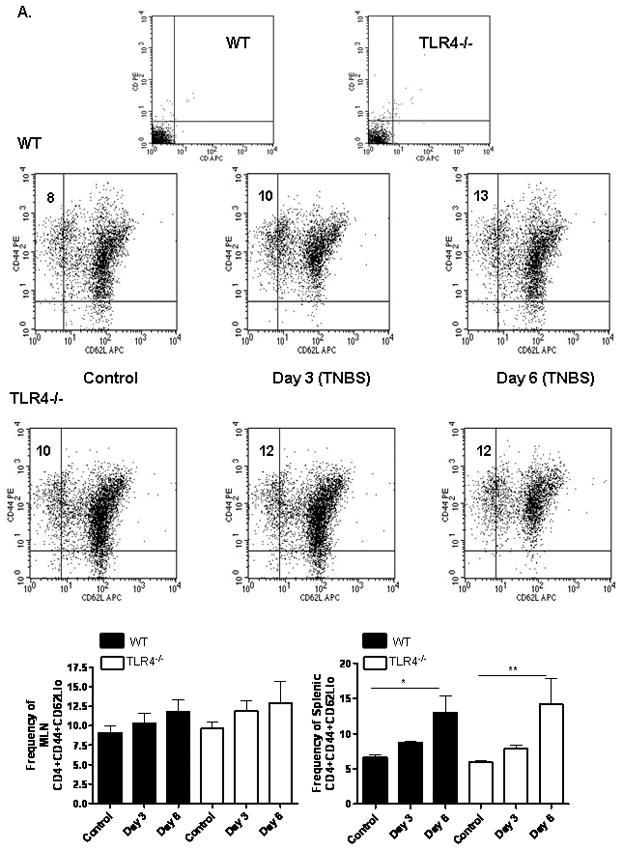
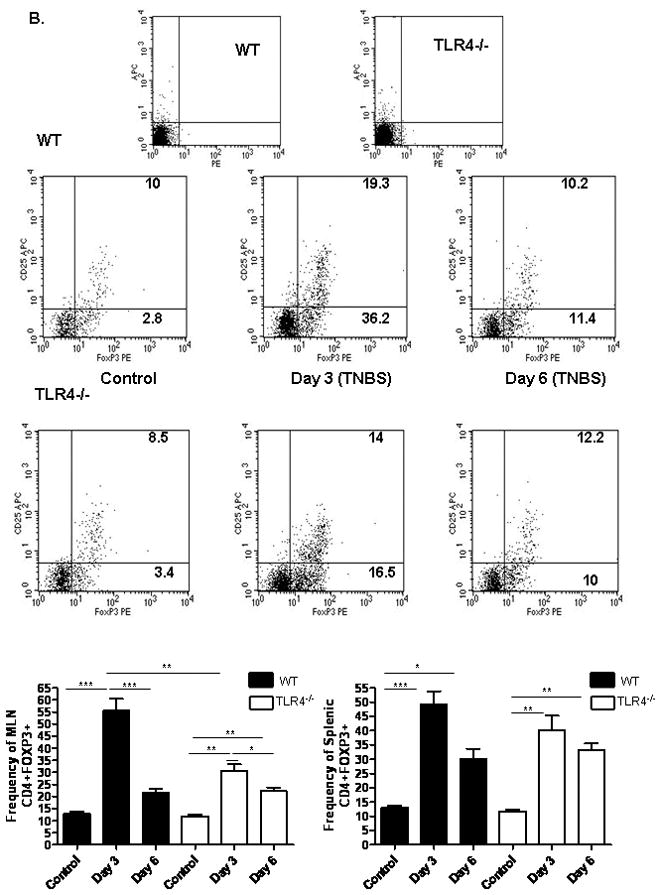
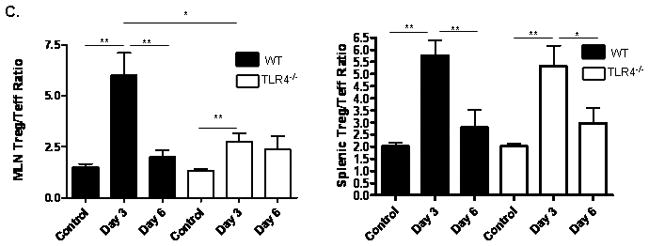
Figure 6. TLR4 Dependent T Lymphocyte Responses to TNBS Administration.


(A) The effect of TNBS administration upon the frequency of mesenteric lymph node (MLN) or splenic CD44+CD62Llo activated/memory T lymphocytes was determined by flow cytometry at days 3 and 6 from WT (n=6) and TLR4 −/− (n=6) mice, as well as WT (n=8) and TLR4 −/− (n=10) controls. Representative scatter graphs from MLN for each group are shown, as well as the mean (SEM). The first two scatter graphs are for the isotype controls used to set the gates. (B) The frequency of MLN or splenic CD4+foxp3+ regulatory T lymphocytes was determined by flow cytometry at days 3 and 6 from WT (n=5) and TLR4 −/− (n=6) mice, as well as WT (n=8) and TLR4 −/− (n=10) controls. Representative scatter graphs from MLN for each group are shown, as well as the mean (SEM). The first two scatter graphs are for the isotype controls used to set the gates. (C) The Treg/Teff ratio was calculated for each mouse from the MLN or splenic CD4+foxp3+ regulatory T lymphocyte and CD44+CD62L− activated/memory T lymphocyte frequencies. The mean (SEM) for each group was as shown. *p < 0.05, **p < 0.01, ***p < 0.001 by ANOVA with Bonferroni’s multiple correction test.
