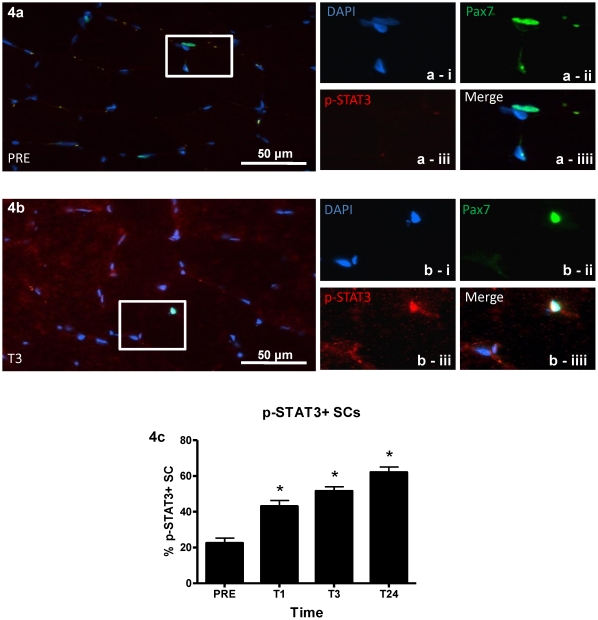
Figure 4. p-STAT3+/Pax7+ cells.
(4a) Representative merged image of PRE at 40× magnification with inset box showing (a-i) DAPI+ nuclei, (a-ii) Pax7+ nuclei, (a-iii) no p-STAT3 stained nuclei and (c-iiii) a merged image. (4b) Representatvie merged image of T3 at 40× magnification with inset box showing (b-i) DAPI+ nuclei, (b-ii) Pax7+ nuclei, (b-iii) p-STAT3+ nuclei and (b-iiii) a merged image showing co-localiztion. Note that punctate p-STAT3 is not present at PRE but co-localizes with Pax7 at T3 and that there is an increase in diffuse fiber staining that occurs from PRE to T3. (4c) Percentage of p-STAT3+ SC as quantified over the time course peaking at T24. Values are reported as mean ± S.E.M. *p<0.05 vs. PRE.

