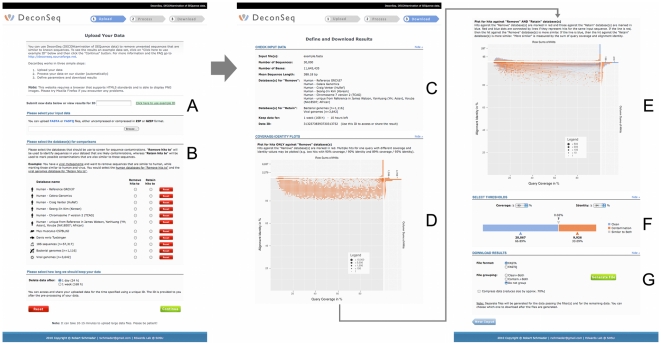
Figure 3. DeconSeq web interface.
Screenshots of the DeconSeq web interface at different steps of the data processing. The user can either input a data ID to access already processed data (A) or input a new sequence file and select the database (B). After processing the data, the results are shown including the input information (C), Coverage vs. Identity plots for “remove” databases (D) and “retain” databases (E), classification of input data into “clean”, “contamination”, and “both” (F), and download options (G).

