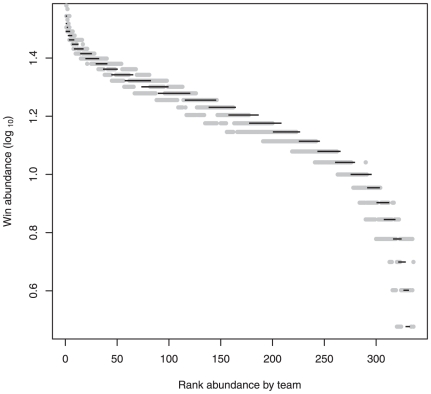
Figure 2. Rank abundance of college basketball wins by team.
The abundance of wins in college basketball, a result of competition between teams of unequal abilities, creates the same pattern used by ecologists to infer mechanism from species abundance distributions (SADs). The log10 abundance of college basketball wins is ranked by team, just as the abundance of individuals is ranked by species for ecological communities. Mean wins (gray) across 2004 to 2008±95% CI are given along with random (Normal, µ = 16, σ = 6) wins (black), and these random and observed patterns are not significantly different (see text).

