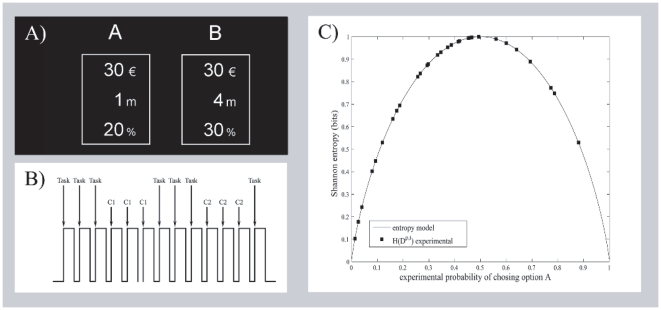
Figure 1. Overview of the decision making paradigm.
A. Visual presentation. Example of visual presentation with two options shown to the participants during the decision-making task. This presentation corresponds to the task configuration  . B. Presentation design. The decision-making trials were presented in blocks of three and were interleaved alternatively with one of the different controls (C1, C2), which also appeared in blocks of three. C. Shannon entropy. Continuous line stands for the entropy model with respect to the probability (dichotomous variable) and squares refer to experimental entropy values of the pooled decisions,
  , made at different task configurations,
  . Note that entropy model is symmetric to the probability. It reaches low values when the variable under study takes most of the times either one value or the other, and reaches its maximum when the random variable takes each of the
  possible values with
  of probability.

