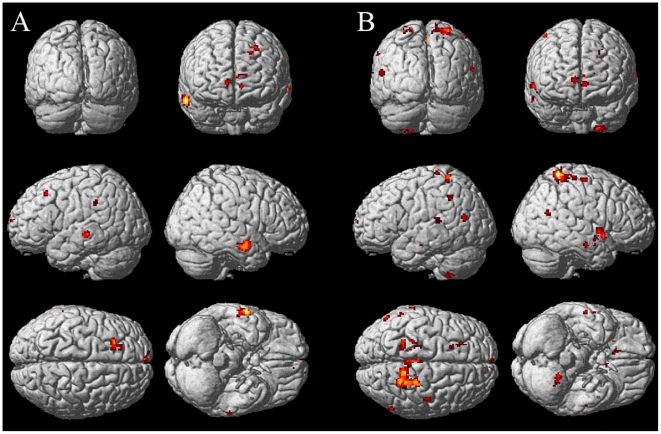
Figure 4. Functional integration of uncertainty.
A. Clusters that increment functional connectivity with right MCC as entropy  increases (PPI analysis). B. Clusters that increment functional connectivity with pre-SMA(bilateral) as entropy
  increases. This is the result of a conjunction analysis of the PPIs seeded in left and right pre-SMAs. The psychological variable was the Shannon entropy (
 of the decisions associated to each task configuration.

