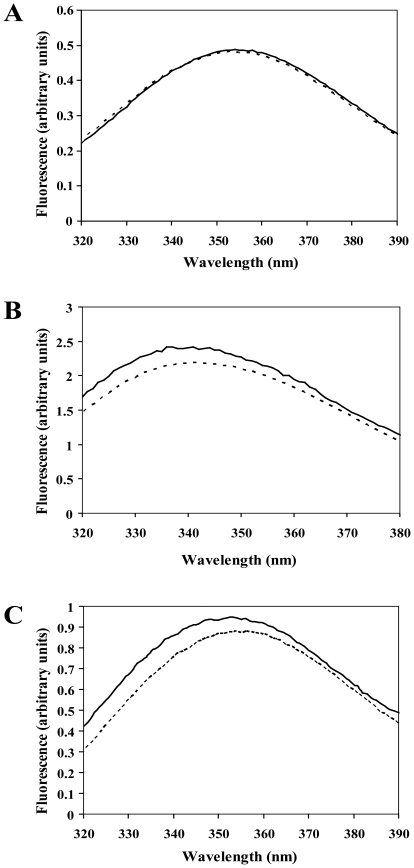
Figure 3. HrpB2XAC induced changes in HrcUXAC fluorescence.
Fluorescence emission spectra of HrcUXAC_207-264 (A), HrcUXAC_207-357AAAH (B) and HrcUXAC_His277-357 (C) in the absence (dotted lines) and presence (solid lines) of HrpB2. All proteins (2 µM) were dissolved in 5 mM sodium acetate (pH 6.0). Spectra were recorded at 25°C using an excitation wavelength of 280 nm.

