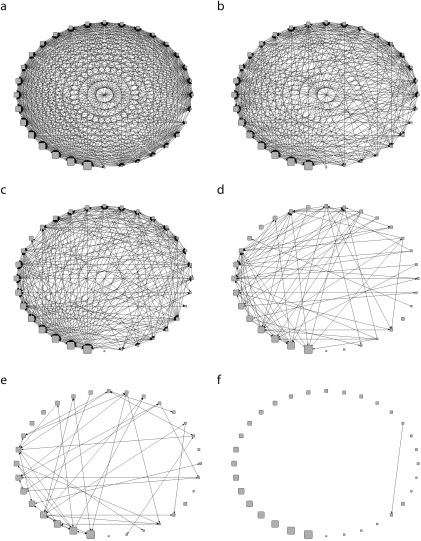
FIGURE 1.
Sociograms depicting patient sharing among all hospitals within 1 year of discharge: 2005–2006, Orange County, CA.
Note. Hospital patients were admitted during the 2005 calendar year. Diagrams on the left side are binary sociograms of the total patient-sharing network at 3 different patient-sharing thresholds: ≥ 1 patient (a), ≥ 10 patients (c), and ≥ 100 patients (e). Diagrams on the right side are binary sociograms for the uninterrupted patient-sharing network at the same 3 patient-sharing thresholds (b, d, and f, respectively).

