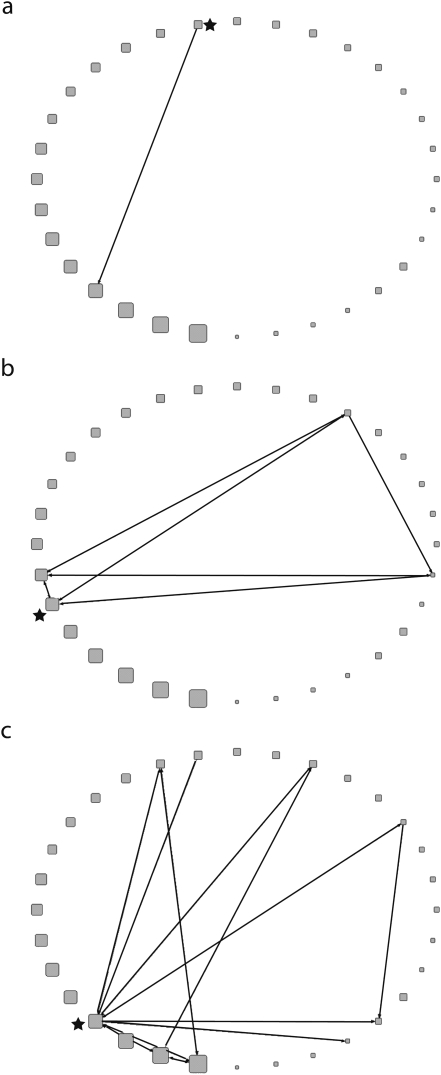
FIGURE 2.
Ego networks depicting 1-step connections of a relatively isolated hospital (a), moderately connected hospital (b), and expansively connected hospital (c): 2005–2006, Orange County, CA.
Note. Results shown are for the total patient-sharing network at the ≥ 100 patients threshold. The star represents the ego hospital.

