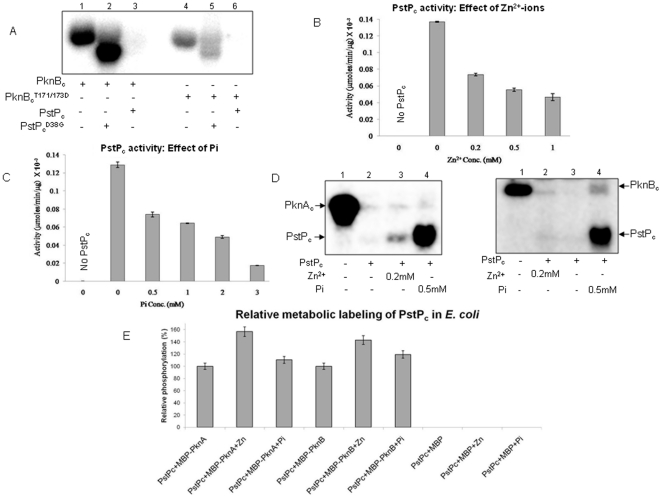
Figure 5. Factors affecting PstP activity.
(A) Auto-dephosphorylation of PstPc: Autoradiogram showing phosphorylation by PknBc. PstPc and PstPc D38G (3 µg each) were used for in vitro phosphorylation assay by PknBc and PknBc T171/173D (2 µg each). Since PknBc T171/173D cannot be dephosphorylated by PstPc, lack of signal signifies auto-dephosphorylation of phosphatase. PstPc D38G was used as positive control to show that PknBc T171/173D is active. Regulation of PstPc activity: pNPP assay showing the effect on activity of PstPc (1 µg) by (B) Zn2+ and (C) Pi. pNPP assay was carried out for 30 mins and activity was calculated as a measure of µmoles of pNPP hydrolyzed per min per µg of protein. The error bars show SD of three independent experiments. (D) Phosphorylation of PstPc: Autoradiogram showing the phosphorylation of PstPc (1 µg) by GST-PknAc (left panel) and GST-PknBc (right panel) in presence of 0.2 mM Zn2+ and 0.5 mM Pi. Since His6-tagged STPKs were not resolved properly from PstPc on SDS-PAGE (Figure S5), the assay was also performed with GST-tagged kinases having higher molecular weights. (E) Metabolic labeling of PstPc by PknA and PknB in E. coli in presence of Zn2+ and Pi: Phosphorylation level of PstPc was observed to be increased when Zn2+ (4 mM) and Pi (2 mM) were added during the culture conditions and subsequent processing steps. The autoradiograms obtained after SDS-PAGE were analyzed by ImageGauge software and intensity of the band corresponding to PstPc phosphorylation without any added factor was taken as 100%. Relative phosphorylation is depicted in the bar graph.

