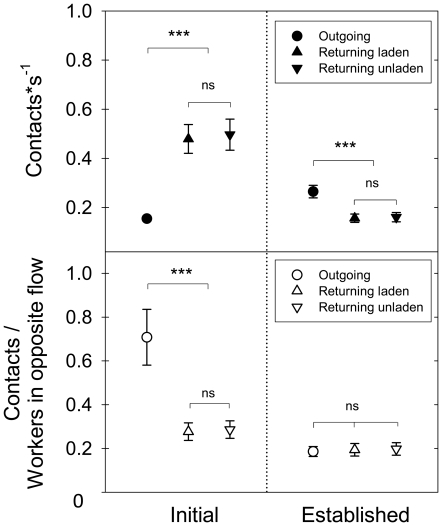
Figure 2. Interactions between outgoing and returning workers on the foraging trail.
Top) Rate of head-on-contacts (mean±SD) with workers coming from the opposite direction for single outgoing, returning laden and unladen workers during both the initial and established foraging phases (Initial: F2,33 = 28.03, p<0.001; Established: F2,33 = 8.23, p<0.01; asterisks indicate a difference at p<0.01 after a Tukey post-hoc test, Log10 transformed data). Bottom) Number of head-on-contacts divided by the number of workers in the opposite flow, for both foraging phases (Initial: F2,33 = 9.82, p<0.001; Established: F2,33 = 0.009, p = 0.91, NS; asterisks indicate a difference at p<0.01 after a Tukey post-hoc test, Log10 transformed data).

