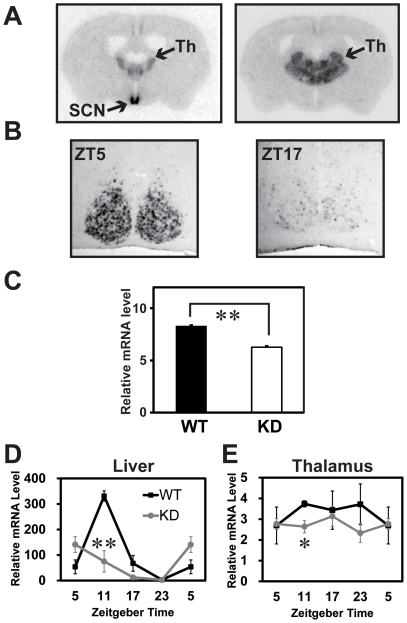
Figure 1. Spatial and temporal expression patterns of the Rgs16 mRNA in brain and its reduction in the KD mice.
A, B, in situ hybridization performed on brain sections. A, Specific and intense signals were observed in the SCN and thalamus (Th). B, Diurnal rhythms of the Rgs16 transcript were observed in the SCN. C, ISH quantification of the Rgs16 mRNA in the KD and WT SCN (n = 8 each) at ZT5. **P<0.01 vs. WT (Student's t-test). D, Expression of Rgs16 in the KD and WT liver observed by qPCR. **P<0.01 vs. WT (Student's t-test). ##, P<0.01 circadian gene expression profile by 2-way ANOVA (WT vs. KD mice; n = 3–4). E, Expression of Rgs16 in thalamus of the KD and WT mice (n = 3–4). *P<0.05 vs. WT.

