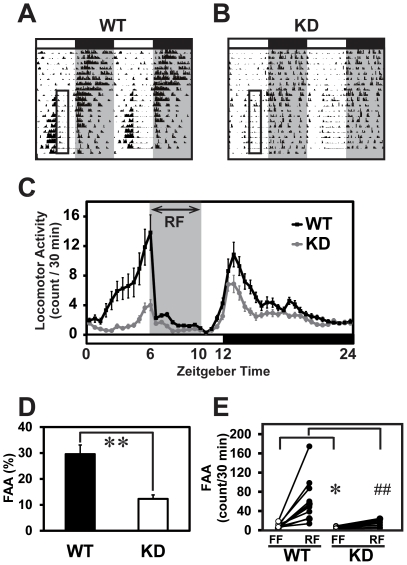
Figure 4. Attenuated FAA in the KD mice under daytime-RF.
A, B, Examples of double-plotted actograms of WT (A) or KD (B) mice under RF. The RF time was set at ZT6–ZT10 (open box). Whereas WT mouse showed a strong FAA (A), those of KD were very weak (B). C, Averaged daily activity plot of the KD and WT mice under RF. D, Average percentages of FAA [100× activity counts (ZT2-6)/24-hour activity counts] during the last three days of RF between WT and KD mice were compared (n = 11 each). **P<0.01 vs. WT (Student's t-test). E, FAA counts of individual mice during 4 hours preceding RF (ZT2-6) averaged over the first 7 days of FF and the following 12 days of RF were compared in each genotype (n = 11 each). *P<0.05, vs. WT in FF; ##P<0.01 vs. WT in RF (Student's t-test).

