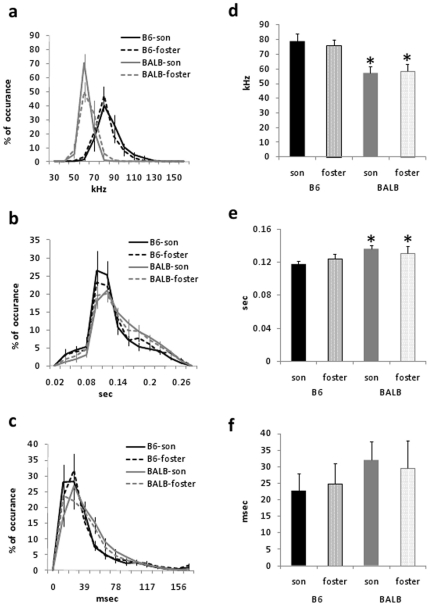
Figure 3. Song parameters of fostered males.
Song parameters in B6-son, B6-foster, BALB-son, and BALB-foster male mice. The distribution histogram of the peak frequency (a) and intervals (b), but not the duration (c), of the syllables demonstrated significant strain differences, regardless of the fostering. Mean peak frequency (d) and interval (e) significantly differed between genetic B6 and BALB groups. Data are expressed as mean ± SEM; *p<0.05 vs. B6-son and B6-foster mice.

