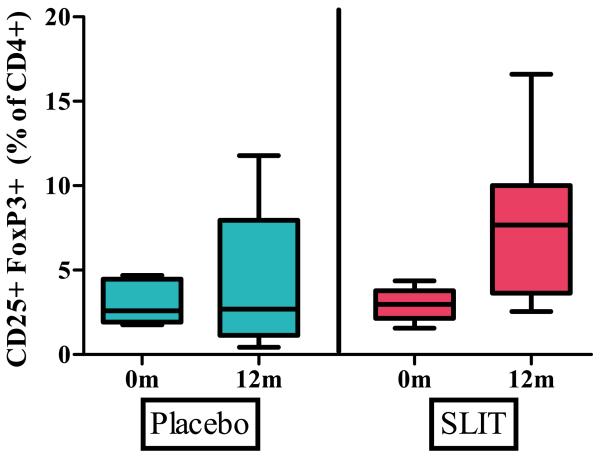
Figure 6.
Percent of T regulatory cells at baseline and after 12 months of peanut SLIT or placebo.
Although an increase in TRegs was seen after 12 months of peanut SLIT, this did not reach significance. Boxes represent interquartile range with a line at the median. Bars represent the min and max values.

