Figure 1.
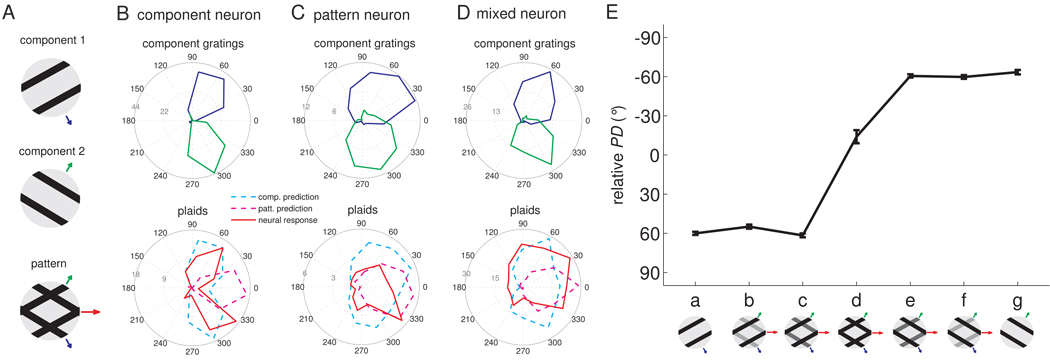
The motion integration properties of somatosensory neurons estimated from their responses to type 1 plaids. A. The plaid is constructed by non-additive superimposition of two component gratings that move in directions separated by 120°. The velocity (direction and speed) of the two components and of the resulting plaid are denoted with blue, green and red arrows, respectively; the length of the arrows is proportional to the speed of the components (blue and green) or of the pattern (red). Responses of a typical (B) component neuron, (C) pattern neuron, and (D) “mixed” neuron. The angular coordinate denotes the direction of motion of the stimulus (in degrees), the radial coordinate the response (in impulses per second). The blue and green traces are the neural responses to component gratings 1 and 2, respectively, and the red trace shows the neural response to plaids (with the two component gratings at equal amplitude). Component predictions (dashed cyan traces) are constructed by summing the responses to the component gratings and corrected for baseline firing rate. Pattern predictions (dashed magenta traces) are tuning curves measured using simple gratings. Component neurons yield bimodal tuning curves when tested with plaids (red trace in B), similar to those obtained when each component grating is presented alone. In contrast, pattern neurons yield a unimodal tuning curve when tested with plaids (red trace in C), centered on the veridical direction of motion of the plaid. Interestingly, many pattern neurons exhibited asymmetric tuning curves when tested with plaids. The “mixed” neuron (D) exhibited an intermediate pattern of responses to plaids. E. Neuronal PD of the example pattern neuron shown in C as component 1 is morphed into a plaid, which is then morphed into component 2 (0° corresponds to pattern motion).

