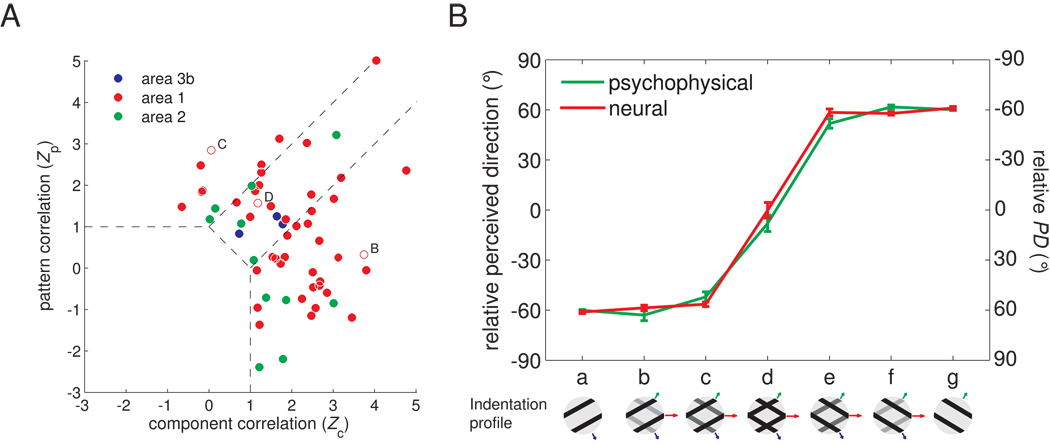
Figure 2.
Quantifying the motion integration properties of somatosensory cortical neurons. A. Integration properties of somatosensory cortical neurons derived from their responses to type 1 plaids (cf. Movshon and Newsome, 1996). Each neuron’s integration properties are indexed by characterizing the degree to which each of its responses to plaids matches the corresponding response of an idealized component or pattern neuron. Zc and Zp are the Fisher’s z-transforms (Hotelling, 1953) of the partial correlation between the measured responses and the responses of an idealized component and pattern neuron, respectively. Zc and Zp are shown for all motion-sensitive neurons in somatosensory cortex (blue: area 3b; red: area 1; green: area 2). Data points in the upper left quadrant indicate pattern tuning, whereas points in the lower right quadrant indicate component tuning. Data points intermediate between those two indicate “mixed” tuning properties. The two dashed lines denote the criteria at which the absolute difference between Zp and Zc is 1 and separate “pattern,” “mixed,” and component neurons from one another. The open symbols correspond to the example neurons shown in Figure 1 (B. the component neuron; C. the pattern neuron; D. the “mixed” neuron). B. PD of pattern-like neurons and perceived direction as component 1 is morphed into a plaid, which is then morphed into component 2. Neurons whose plaidness index (PI = Zp-Zc) was greater than the median value were used to compute the population PDs. Note that matching relative PDs and perceived directions are of opposite polarity. For example, a neuron with a relative PD of −60° would yield a perceived direction of 60°.

