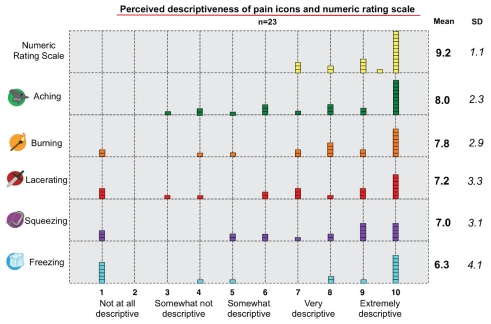
Figure 2).
Perceived descriptiveness of the Iconic Pain Assessment Tool icons and numerical rating scale in relation to the quality and intensity of chronic pain, respectively. Frequency distribution of responses and arithmetic means ± SDs are shown for 23 subjects. Note for interpretation: Each individual block represents a single participant response. For instance, a total of three participants gave the numerical rating scale a rating of 7

