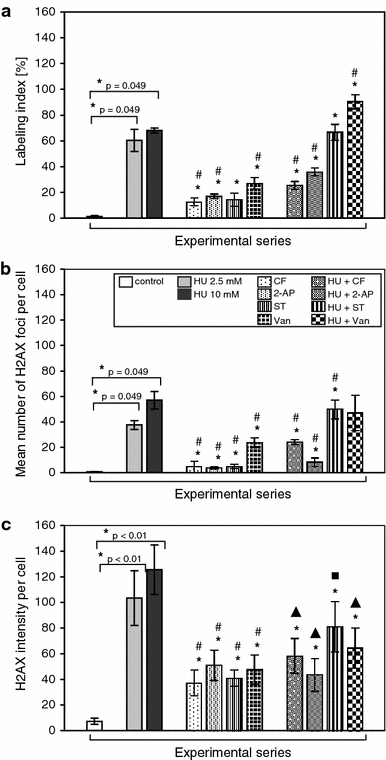
Fig. 8.

a Immunolabeling indices (%) estimated for HeLa cells stained with anti-H2AXS139 antibodies. Columns, mean from three independent experiments; bars, SD. * P = 0.049, compared with control (Mann–Whitney tests); # P = 0.049, compared with 2.5 mM HU (Mann–Whitney tests). b Mean number of intranuclear phospho-H2AX foci generated in HeLa cells. Columns, mean from at least 300 cells per sample taken from three independent experiments; bars, SD. * P = 0.049, compared with control (Mann–Whitney tests); # P = 0.049, compared with 2.5 mM HU (Mann–Whitney tests). c Quantification of anti-H2AXS139 pixel intensity per cell. Columns, mean from at least 106 cells per sample taken from three independent experiments; bars, SD. * P < 0.01, compared with control (Mann–Whitney tests); # P < 0.01, compared with 2.5 mM HU (Mann–Whitney tests); filled diamond, P < 0.01, compared with 2.5 mM HU (t tests with Cochran-Cox correction); filled square, P < 0.001 compared with 2.5 mM HU (t tests on log-transformed values, which were normally distributed)
