Fig. 5.
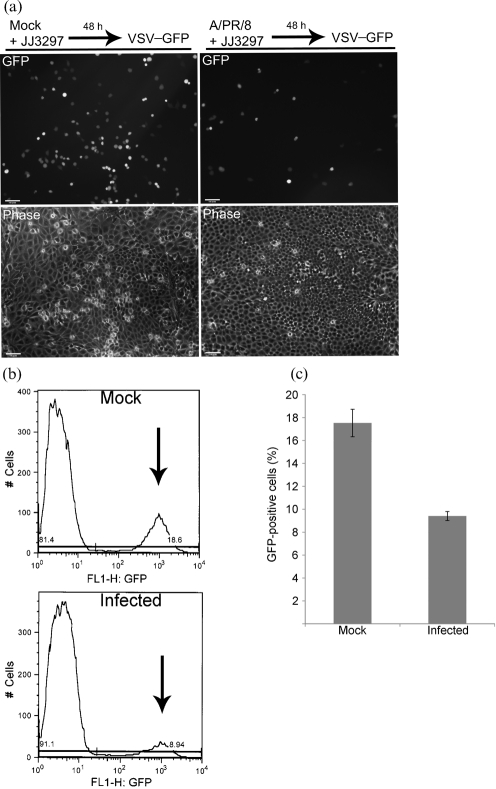
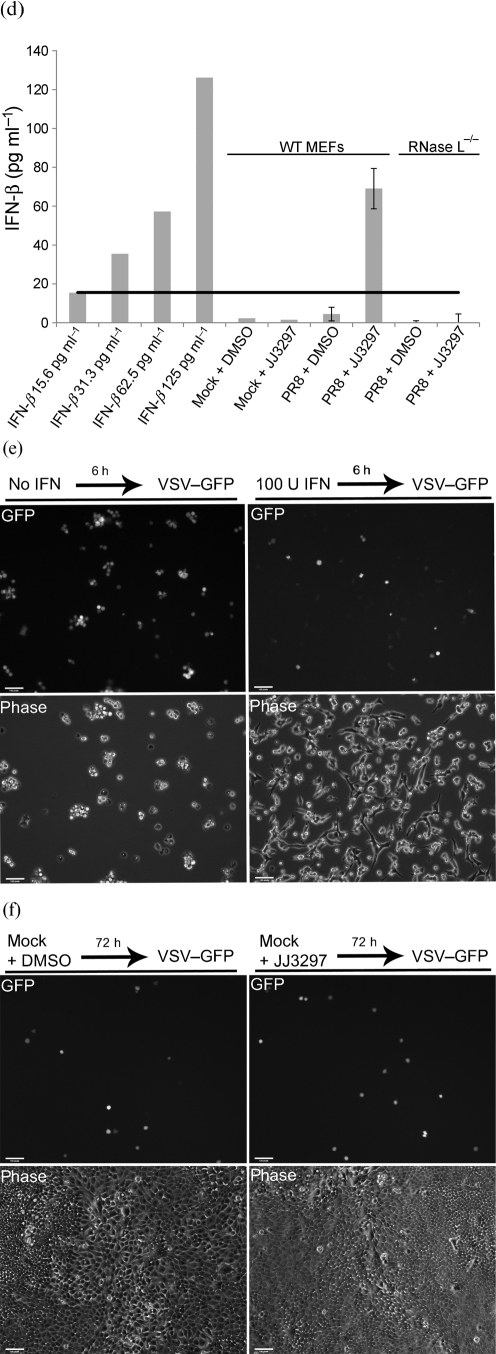
Measurement of the antiviral state and IFN production. (a) MDCK cells were mock infected or infected with A/PR/8 at an m.o.i. of 0.01 and treated with 5 μM JJ3297. After 48 h, the cells were infected with VSV–GFP at an m.o.i. of 5, incubated overnight and visualized live for GFP fluorescence and by phase-contrast microscopy. (b) Example of data from flow cytometry. Arrows indicate GFP-positive cells. Mock-infected cells were not infected with A/PR/8, but were treated with JJ3297 for 48 h, followed by infection overnight with VSV–GFP. Infected cells were infected with A/PR/8 for 48 h in the presence of JJ3297, followed by infection overnight with VSV–GFP. (c) Quantification of data from quadruplicate experiments as illustrated in (b). Bars represent the percentage of cells in the population expressing GFP. (d) Wild-type (WT) MEFs or RNase L−/− MEFs were mock infected or infected with A/PR/8 at an m.o.i. of 0.1 and incubated in the presence of 5 μM JJ3297 or 1 % DMSO. After 24 h, supernatants were harvested and the concentration of IFN-β was determined by ELISA. Increasing concentrations of IFN-β standards were included for comparison (left columns). Black horizontal line, IFN-β level of 15.6 pg ml−1 which is the lower limit of detection for the ELISA assay. (e) MEFs are protected from VSV infection by recombinant IFN-β. Cells were pre-treated with 100 U mouse recombinant IFN-β ml−1 for 6 h (where indicated) and then infected with VSV–GFP at an m.o.i. of 5. After overnight incubation, cells were visualized live for GFP fluorescence and by phase-contrast microscopy. (f) Uninfected MDCK cells were incubated in the presence of 1 % DMSO or 5 μM JJ3297. After 72 h, the cells were infected with VSV–GFP at an m.o.i. of 0.5, incubated overnight and visualized live for GFP fluorescence and by phase-contrast microscopy.


