
Table 1.
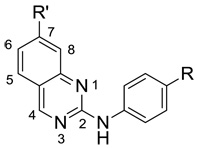
Biochemical and Cell-based IC50 Values, and Mouse Plasma and Brain levels for a series of 2,7-substituted quinazolinesa
 | |||||||
|---|---|---|---|---|---|---|---|
| compound | R' | R | JNK3 IC50 (µM) |
JNK1 IC50 (µM) |
c-jun IC50 (µM) |
bmouse [plasma] |
(µM) [brain] |
| 3 |  |
0.09 | 0.05 | 0.31 | 17.8 | 7.17 | |
| 8a |  |
0.05 | 0.04 | 0.12 | 42.9 | 1.31 | |
| 8b |  |
0.7 | nt | nt | nt | nt | |
| 8c |  |
4.4 | nt | nt | nt | nt | |
| 8d |  |
0.21 | nt | nt | 26.7 | 8.1 | |
| 8e | 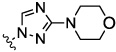 |
0.73 | nt | nt | nt | nt | |
| 8f | 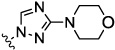 |
>20 | nt | nt | nt | nt | |
| 8g | 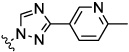 |
0.05 | nt | 0.04 | nt | nt | |
| 8h | 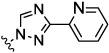 |
0.06 | 0.1 | 0.29 | 13.1 | 1.37 | |
a
JNK3 biochemical IC50 values are the averages of four or more experiments, and the JNK1 and cell-based IC50 values are the averages of two or more experiments. All standard deviations are ≤44% for the biochemical and ≤81% for the cell-based assays.
b
10 mg/kg ip 2h.
nt = not tested.