
Table 3.
Biochemical and Cell-based IC50 Values, and Mouse Plasma and Brain Concentrations for 2-position Substitutions Designed to Reduce Polar Surface Area and Molecular Weighta
 | ||||||
|---|---|---|---|---|---|---|
| compound | R | JNK3 IC50 (µM) |
c-jun IC50 (µM) |
bpolar surface area |
cmouse [plasma] |
[µM] [brain] |
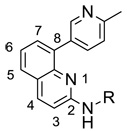
| 9a | 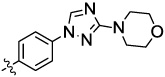 |
0.03 | 0.02 | 90 | 2.72 | 0.15 |
| 10a | 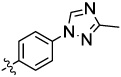 |
0.03 | nt | 77 | 2.31 | 0.23 |
| 10b |  |
0.06 | 0.63 | 68 | 0.78 | 1.06 |
| 10c |  |
0.17 | nt | 49 | nt | nt |
| 10d | 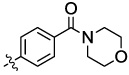 |
0.09 | nt | 79 | 0 | 0 |
| 10e |  |
0.05 | 0.93 | 69 | nt | nt |
| 10f |  |
0.03 | 3.0 | 69 | nt | nt |
a
JNK3 biochemical IC50 values are the averages of four or more experiments, and the JNK1 and cell-based IC50 values are the averages of two or more experiments. All standard deviations are ≤44 % for the biochemical and ≤81 % for the cell-based assays.
b
Polar surface area calculated by ChemBioDraw Ultra 11.0.
c
10 mg/kg ip 2h.