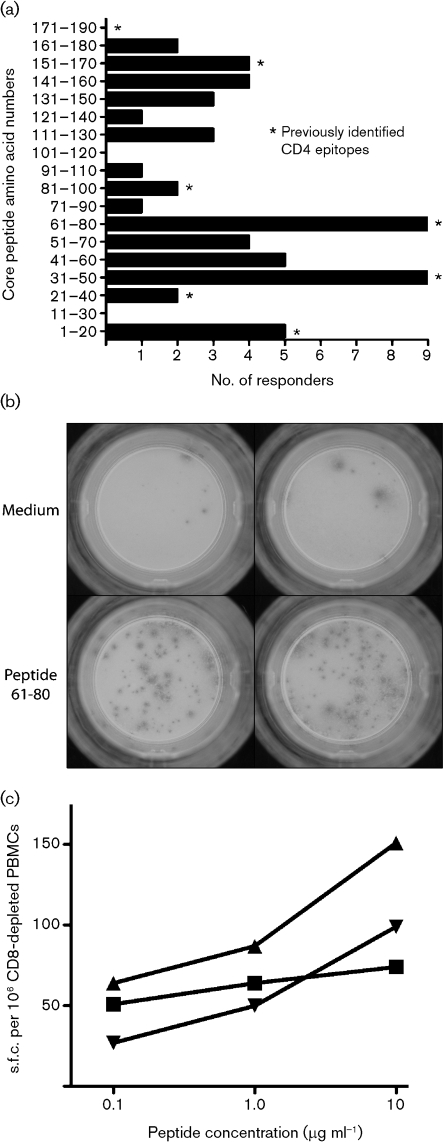
Fig. 1.
IFN-γ ELISPOT response to core peptides. (a) The frequency of CD4+ T-cell responses against the panel of core peptides is indicated. Data were derived from Table 2. The sequences of the individual peptides are available in Supplementary Table S1. All donors were tested against all peptides, and the total numbers of donors positive from the 61 tested is shown. (b) Typical ELISPOT assay from patient 306, showing a positive IFN-γ response to HCV core peptide 61–80 (s.f.u. per 106 CD8-depleted PBMCs=140). (c) Titration experiment using fresh ex vivo CD8-depleted PBMCs from donor 304. The peptide concentration used is displayed on the y-axis, with the background subtracted. Peptides: ▴, 31–50; ▪, 61–80; ▾, 151–170.

