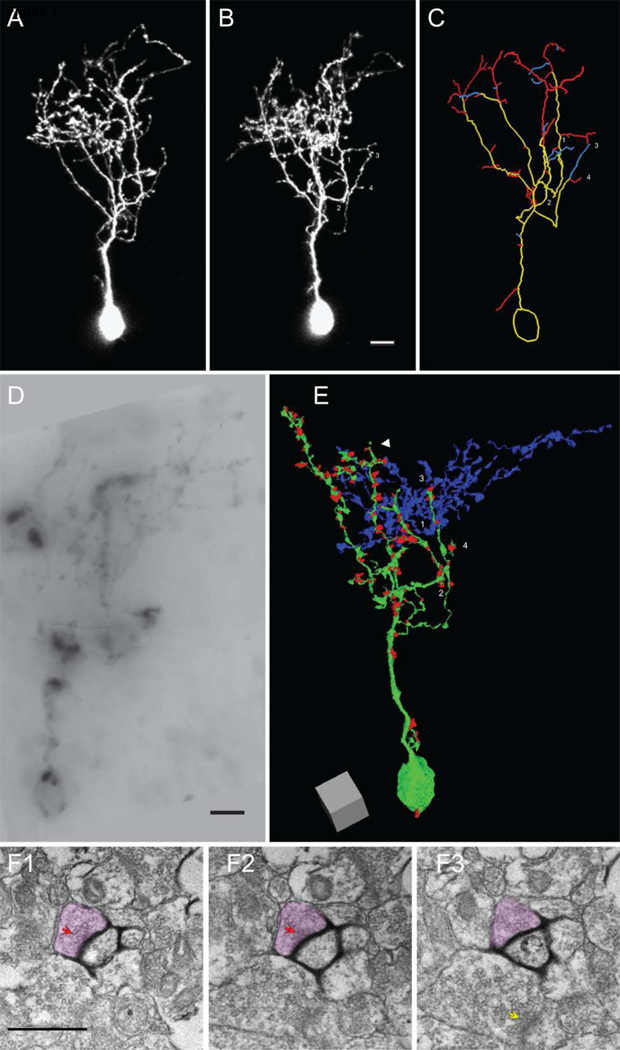
Figure 1. Combined in vivo time-lapse imaging and 3D EM reconstruction of a neuron with synaptic inputs.
(A–B) Two-photon images of an optic tectal neuron from a stage 47 tadpole expressing GFP and mHRP collected over a 24h interval. The branch tips marked by 1–4 in B are also labeled in C and E. (C) Drawing of the dendritic arbor of the neuron shown in A and B. For clarity, the axon is not shown. Branches are color-coded according to their behavior over the previous 24h, yellow: stable; red: extended; blue: retracted. (D) Image of a portion of the mHRP-labeled neuron in a vibratome section visualized by the DAB reaction. (E) 3D reconstruction of the dendritic arbor of the neuron from 2,381 serial EM micrographs. The dendritic branches and soma are in green and presynaptic terminals are represented by red dots. The white arrowhead marks the dendrite shown in F. (F1–3) Serial EM micrographs of a dendrite from the imaged neuron where the mHRP-labeled plasma membrane is visualized with the nickel-intensified DAB reaction. A synaptic contact site onto the labeled dendrite is marked by the red arrowheads. The axon terminal is colored red. Note that a neighboring presynaptic profile does not form a synapse with the labeled dendrite in these or other serial sections, but does form a synapse with a nearby dendrite, marked by the yellow arrow in F3. Scale bar is 10µm in B, 5µm in D, and 500nm in F. Scale box in E is 5µm.

