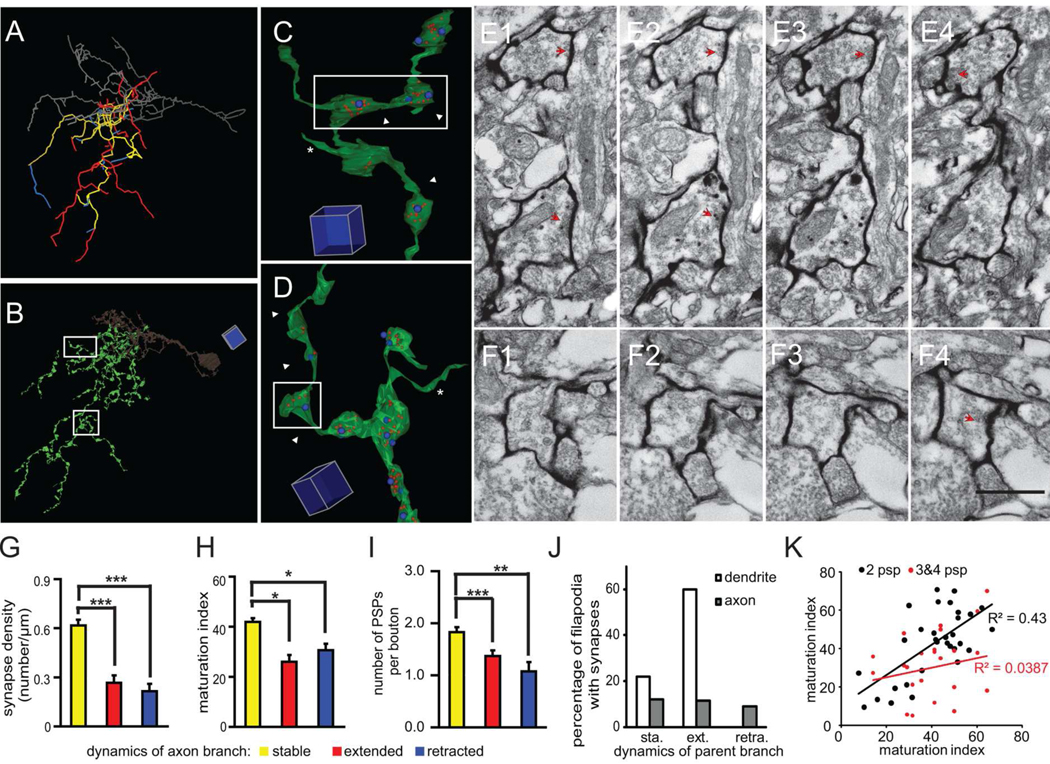
Figure 6. Stable axon branches have a high density of mature synapses.
(A) Axonal branch drawings with dynamics that are color-coded according to the two-photon time lapse images from day 2–3. Yellow: stable, red: extended, blue: retracted. The dendrite is shown in gray. (B) Reconstruction of axonal branches from serial EM sections. (C) Example of a stable axonal branch. Blue dots represent postsynaptic profiles, and red dots represent synaptic vesicles labeled by mHRP. (D) Example of an extended axon branch marked by white arrowheads. (E–F) Serial EM sections show the ultrastructure of axonal boutons from stable and extended branches in E1–4 and F1–4, which are marked by white arrowheads in C and D, respectively. The synaptic contacts are marked by red arrowheads. (G) The density of synaptic contacts from stable, extended, and retracted axon branches. (H) Maturation index of axon terminals from stable, extended, and retracted branches. (I) Number of connections per bouton from stable, extended, and retracted axon branches. (J) Percentage of filopodia emerging from stable, extending or retracting axons and dendrites which form synaptic contacts. About 30% of all axonal filopodia form synapses independent of the dynamic properties of their parent branch. Over 80% of dendritic filopodia form synapses and about 2/3 of them emerge from extending dendrites. (K) Maturation indices of synapses from axonal boutons with only 2 PSPs are more correlated than the indices of synapses in boutons contacting 3 or 4 PSPs for multisynapse boutons on extending axon branches. Scale box is 5µm in B, 1 µm in C and D. Scale bar is 500nm in F and also applied to E. (*: p<0.05; **: p<0.01; ***: p<0.001).

