
Figure 3. Distribution of fitting error.
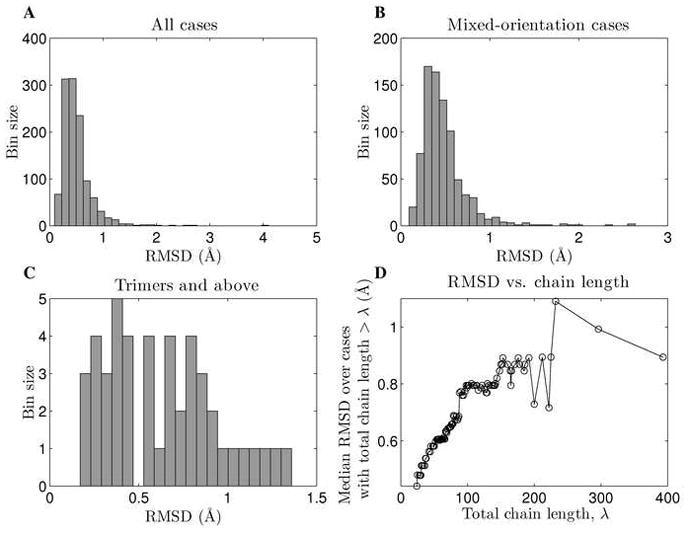
A) The distribution of fitting error (Cα RMSD between a natural structure and its Crick-parameterized version) over all cases. Four structures were fit with RMSD above 2.0 Å, but in 95.7% of cases the RMSD was below 1.0 Å. B) The distribution of fitting error for cases where helices of opposite orientation were present (i.e. anti-parallel dimers and mixed-orientation higher-order oligomers). The performance on these structures is not significantly different from the overall performance. C) Distribution of fitting error for trimers, tetramers and pentamers. D) Fitting error as a function of the total number of residues fit. The y-axis shows the median Cα RMSD over cases where the total number of residues fit was above the corresponding value on the x-axis.