
Figure 4. Distribution of superhelical radius.
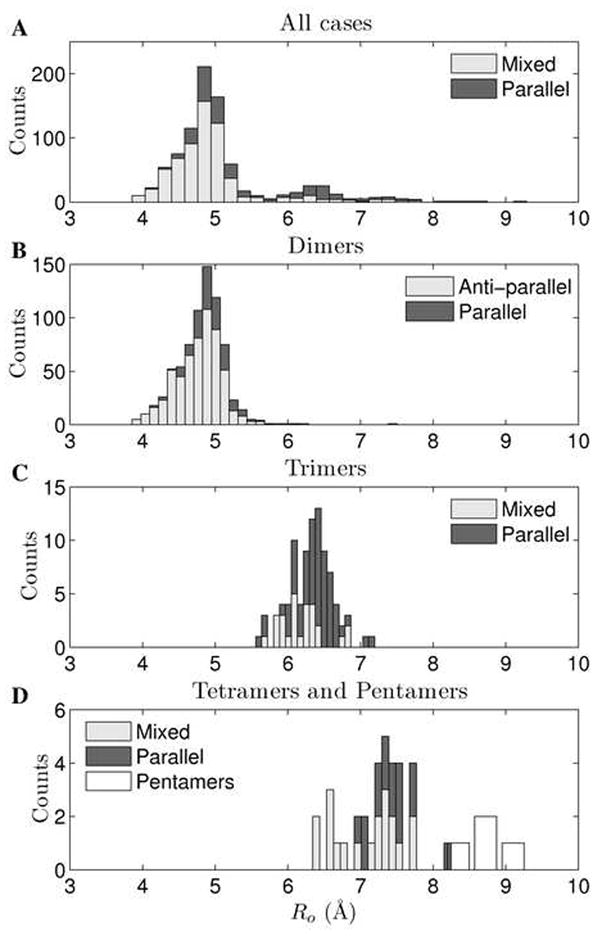
Stacked bar plots show the the overall distribution of R0 (total histogram) as well as contributions to it from structures of parallel orientation (dark gray bars) and anti-parallel or mixed orientation (light gray bars). A) The distribution of R0 is multi-modal with peaks corresponding to different oligomerization states. B)-C) Show distributions of R0 for dimers and trimers, respectively, and D) combines tetrameric and pentameric cases (of the four pentameric structures, all are of parallel orientation). The median values of the distributions are 4.85 Å for dimers, 6.36 Å for trimers, 7.30 Å for tetramers and 8.59 Å for pentamers.