
Figure 8. Distribution of minor-helical phase φ1 in polar coordinates for dimers.
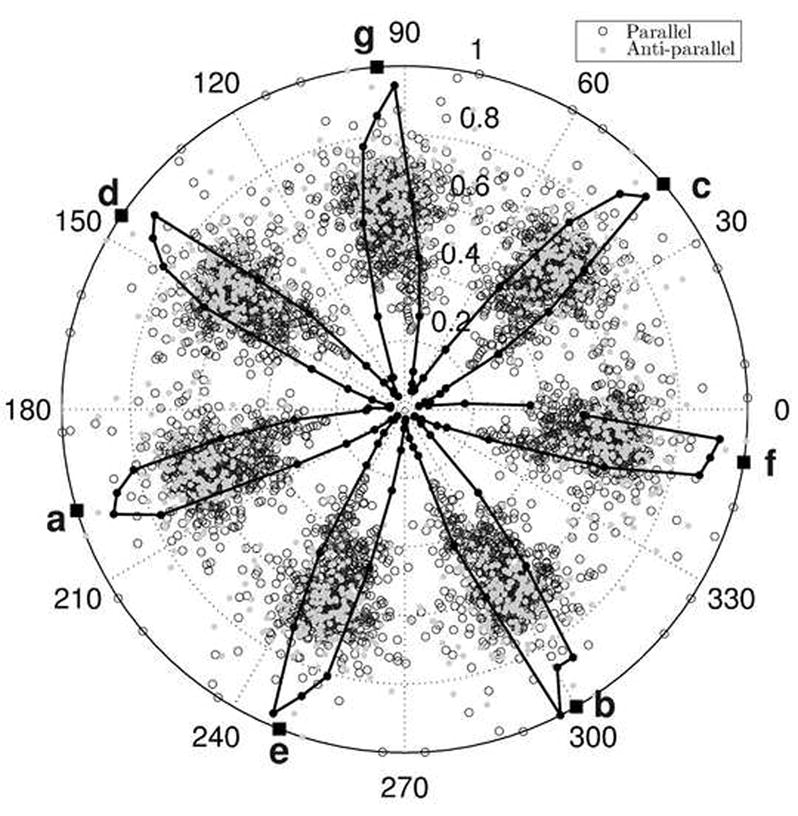
Open and filled circles represent parallel and anti-parallel structures, respectively, with each point corresponding to a single residue within a single structure (to avoid redundancy, only the first seven residues in each chain of each structure were considered). The helical phase is denoted by the angular coordinate and the radial coordinate is proportional to the superhelical radius R0 (normalized for ease of viewing). No detectable correlation between R0 and phase exists. The solid line is a histogram of φ1 distribution (for parallel and anti-parallel orientations combined) constructed with bins of width 3.6°. In this case, the radial coordinate represents frequency of each bin. Solid squares denote the means of the seven peaks of the distribution and corresponding heptad positions are indicated in bold letters.