Fig. 2.
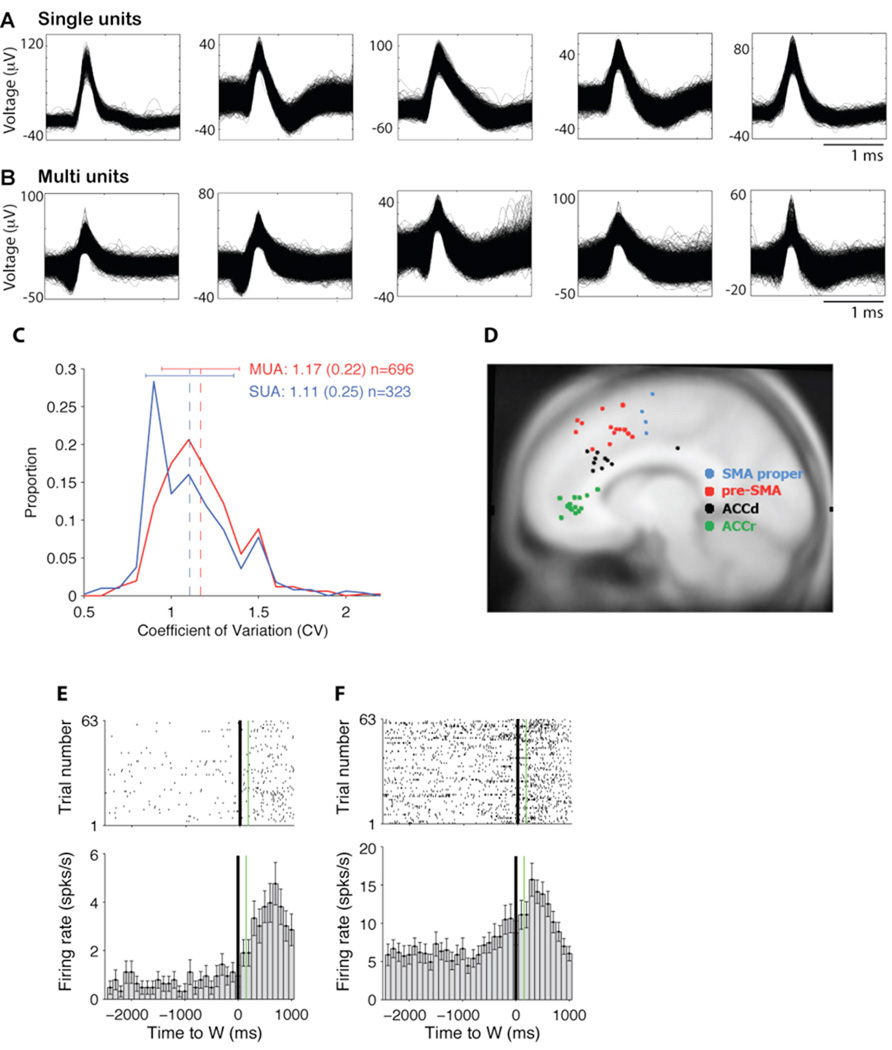
A–B. Example waveforms for five single units (A) and five multi-units (B). After spike sorting, units were classified into single units or multi-units according to the criteria described in (Tankus et al., 2009). C. Distribution of the coefficient of variation of the interspike interval distribution for MUA (red) and SUA (blue). The dashed lines indicate the mean of the distribution and the horizontal bars denote one standard deviation. D. Anatomical location of electrodes in the frontal lobe displayed on a Montreal Neurological Institute (MNI) brain (average of 305 brains) (Collins et al., 1994). Each electrode included 8 recording microwires. (E–F) Raster plots and histograms showing the responses of a neuron in left ACCd displaying a significant response after W (ranksum test, p<10−6) (E), and one neuron in left pre-SMA with response onset prior to W (ranksum test, p<10−3) (F). All plots are aligned to W (time=0). Error bars indicate SEM (n=63 repetitions). The green line in the PSTH denotes the average time of key press across all trials. Bin size for the PSTH=100 ms.

