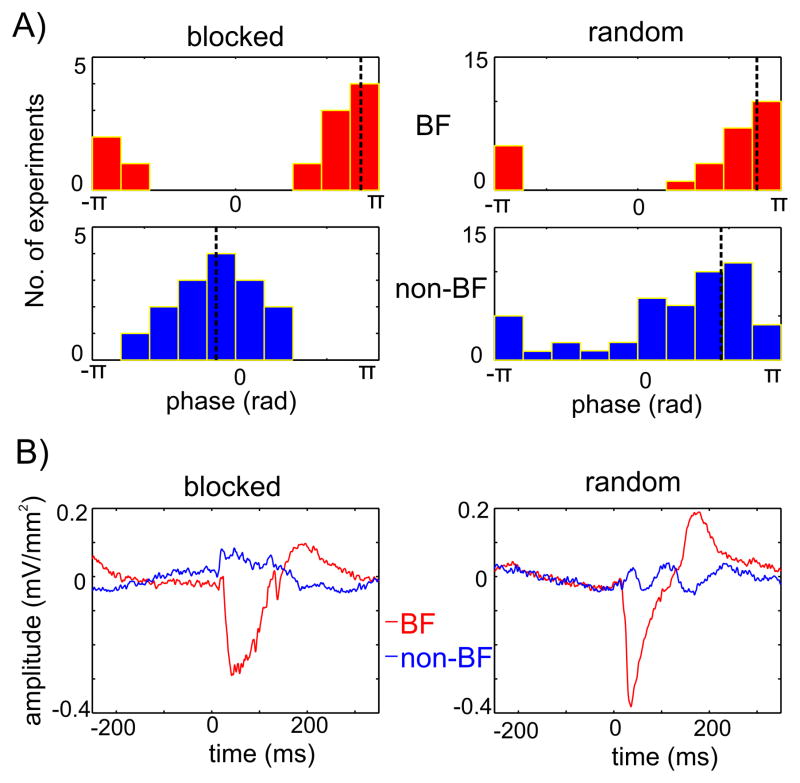
Figure 7. Delta oscillatory entrainment.
A) The distribution of mean delta phases in response to BF (upper) and non-BF (lower) tones, for blocked (left, n=14) and random (right, n=36) streams of pure tones. Black dotted lines show the angular mean of the mean phases. B) Averaged supragranular CSD responses to BF (red) and non-BF (blue) pure tones from an experiment where different frequency pure tones were presented in separate blocks (blocked), and from an experiment where different frequency pure tones were presented randomly (random). Note the opposite sign low frequency pre-stimulus activity in the blocked case.

