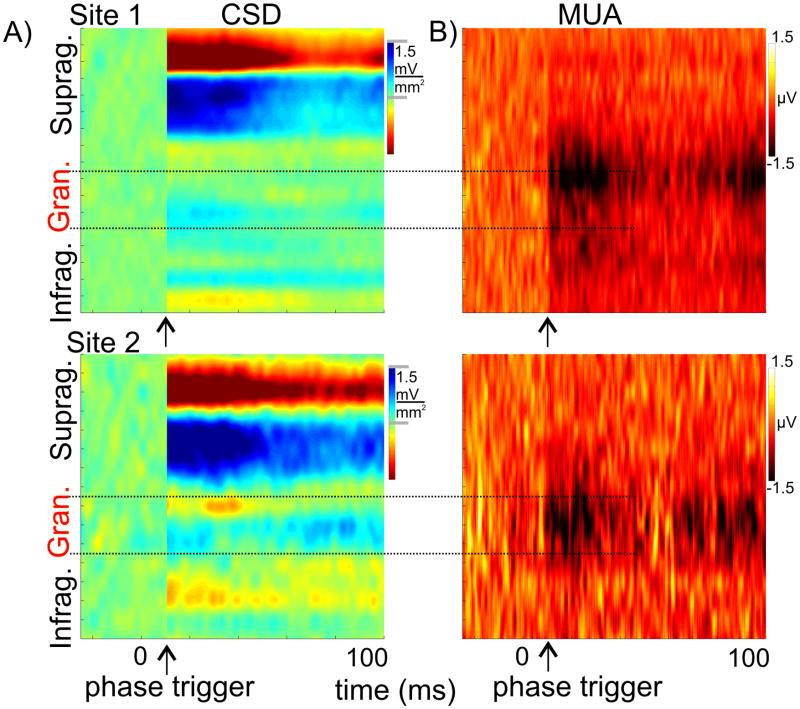
Figure 8. Phase triggered averages of spontaneous CSD and concomitant recorded MUA.
A) The two phase triggered average profiles were created from sponataneous activity recorded in the same locations as CSD response profiles in Figures 3 & 5. The phase triggered profiles (starting at the arrow) are the average of epochs of ongoing activity triggered at phases of supragranular delta, theta and gamma oscillations that correspond to the mean phase of these oscillations in the inhibitory responses. The “baseline” (activity preceding the arrows) was created from averaging randomly selected epochs of ongoing activity. B) Laminar profiles of concomitant MUA

