
Figure 5.
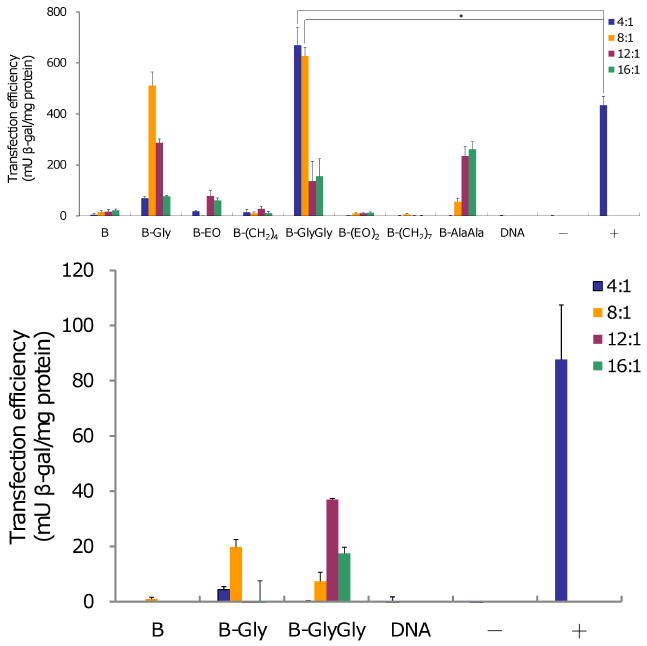
DNA transfection after 48 h in CHO (top) and NIH3T3 (bottom) cells as a function of amphiphiles and DNA molar ratio. Lipofectamine™ 2000 was used as positive control. N=3, mean±SD. * p<0.05
Official websites use .gov
A
.gov website belongs to an official
government organization in the United States.
Secure .gov websites use HTTPS
A lock (
) or https:// means you've safely
connected to the .gov website. Share sensitive
information only on official, secure websites.
DNA transfection after 48 h in CHO (top) and NIH3T3 (bottom) cells as a function of amphiphiles and DNA molar ratio. Lipofectamine™ 2000 was used as positive control. N=3, mean±SD. * p<0.05