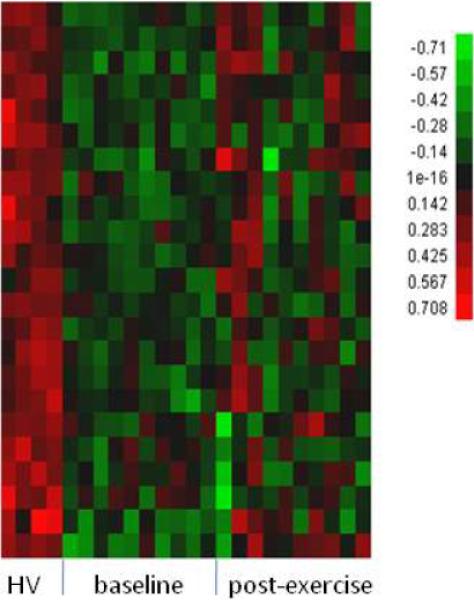
Figure 2B.

Hierarchical clustering of 23 down-regulated genes selected with 2-fold change, 25%FDR and present calls from the comparison of CD133+ gene expression between 10 CAD patients at baseline versus 4 healthy controls (HC). The values are in log10 scale.
