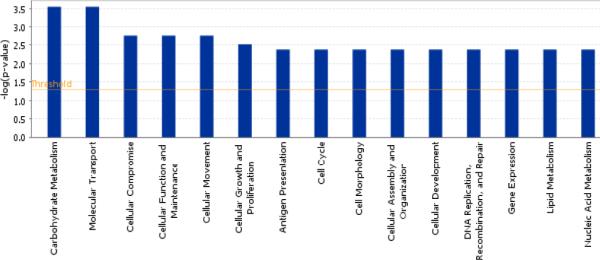
Figure 3.

Distribution of some top molecular and cellular functions associated with the 82 genes selected from baseline CAD (n=10) Vs healthy control (n=4). X axis shows the pathways and the Y axis denotes the P value for each of the pathways represented.
