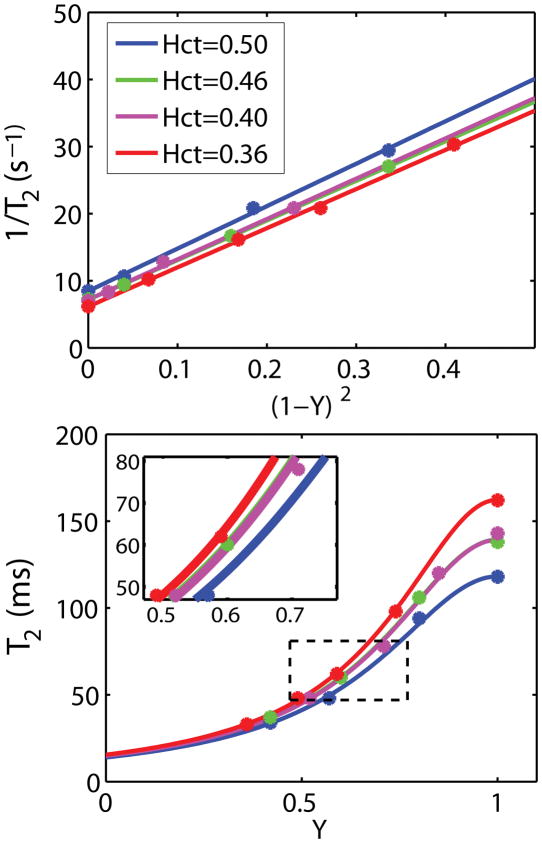
Figure 2.
Dependencies of the transverse relaxation rate of blood at 3T on deoxygenation (a) and oxygen saturation fraction (b). (a) Results for all four Hct values show a linear dependence (Eq. [3]) on the square of deoxygenation level, (1−Y)2 for τCPMG = 10 ms (R2 > 0.99). (b) The corresponding T2 vs. Y curves. The average of the Hct = 0.40 and Hct = 0.46 curves in (a) and (b) were used for the calibration curve for in vivo OEF estimation. The 50 to 80 ms T2 range is zoomed out to show the effect of Hct, which causes only about 4 ~ 6% error as calculated in the Results session. All fit parameters are summarized in Table 1.

