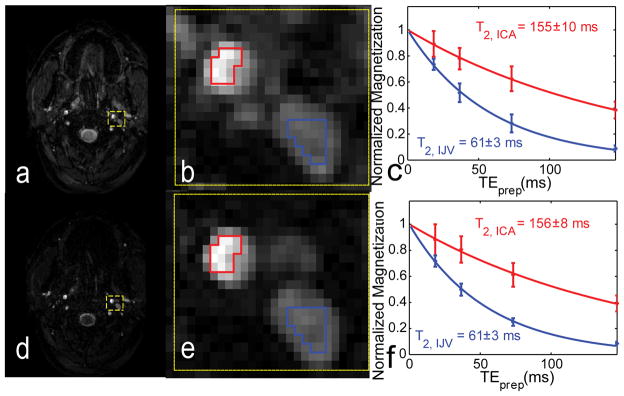
Figure 3.
Effect of the slice-selective pre-saturation block on image contrast and measured T2 values. The first row shows an image (TEprep = 20 ms) collected without saturation (a), with the zoomed-in view in the yellow box (b) and corresponding T2 curves (c) from vascular ROIs (blue: IJV; red: ICA). In the second row, SS saturation was enabled (d–f). By minimizing static tissue magnetization using SS saturation before T2 prep, identifying of ROIs around the jugular veins are substantially facilitated (d, e). This additional pulse also does not affect the T2 fitting for the flowing blood (f). The estimated T2s fitted from the averaged ROI signals are reported with the standard error of the nonlinear fit.

